Central 8.2 Is Bringing An All New Look and Feel to Snare!
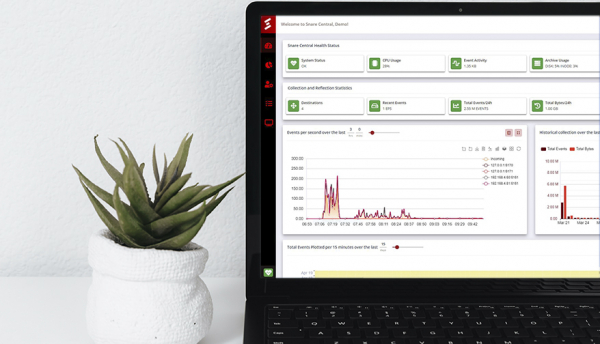
The latest version of Snare features a new GUI with new dashboards and functionality
This next phase in Snare Central development has been geared toward significantly enhancing the end user experience, aiming to bring better insights at-a-glance and more details in fewer clicks. While the aesthetic enhancements will be obvious, Snare has added significant functionality to those dashboards using threshold color changes and easy data filtering and drillthrough capabilities.
Long time users of Snare will notice the difference right away once logged in. Let’s take a quick look at the new dashboard when you log in.
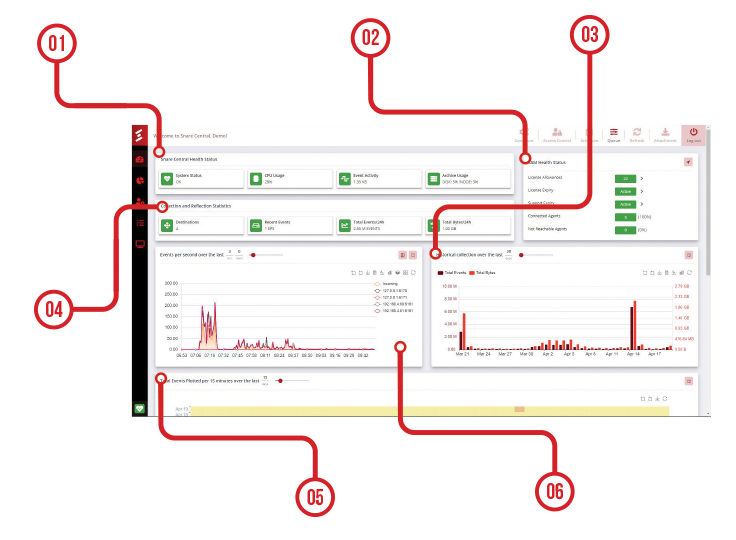
Right away you’ll see these six components.
- Health Statuses
- Snare Agent Management Health Statuses
- Historical Log Collection Over Time
- Collection and Reflection Statuses
- Total Events – Plotted on a Heat Map
- Events Per Second (EPS) Over Time
You can also find Live Events graphed as well as your Scheduled Report Statuses if you scroll down further. Not only that, you can flip the charts for more insight, like flipping the EPS chart to show Bytes Per Second over time.
And easily toggle between chart types, right there on your dashboard before drilling through to the underlying data if further investigation is warranted.
When it comes to GUIs and the power of data visualization, it always helps to see it in action. Snare Central customers can download this latest version in SLDM but whether your a current customer or just shopping around, why don’t you request a consultation with one of our senior solution engineers? They’d love to show you everything new in Central 8.2!
For more information you can check out the page on Snare Central and also download the datasheet.

